
Posted on Jun 17, 2025
")
The Gun Facts CCW Scorecard (first edition) | Gun Facts
425
22
7
7
7
0
Things have changed since "Bruen".
SGT James Murphy, CPT Jack Durish,
SPC Gary Welch, SGT Mark Anderson,
CPL Douglas Chrysler, LTC Trent Klug,
CSM Charles Hayden Passed 7/29/2025, SMSgt David A Asbury,
SSG William Jones,LTC David Brown
SSG Michael Noll, MAJ Dale E. Wilson, Ph.D.
SGM Erik Marquez, CW3 Harvey K.
SFC William Farrell, CPL Ronald Keyes Jr
Sgt (Join to see), SSG (Join to see)
The Gun Facts CCW Scorecard (first edition) | Gun Facts
Posted from gunfacts.infoPosted in these groups:  2nd Amendment
Posted 8 mo ago
Responses: 5
4
4
0
There are no surprises here. Every blue talks a good game about supporting the 2nd Amendment, but when it's time to actually do it, they absolutely dont.
(4)
(0)
3
3
0
When I was a kid my mother worked for the school district and she met a man who operated a boys club which was mainly a firearms safety and marksmanship organization. He worked under the guidelines of the NRA and was very strict about qualification.
During those early years, early to mid 1950's, murders with firearms whether accidental or premeditated were unknown. I didn't hear of one until the late 60's when a fellow took a gun into a church and wounded the janitor then was killed himself by police.
My point is people like my instructor were definitely an asset to the community and should be encouraged everywhere.
http://libertylakesplash.com/news.asp?id=20816
(3)
(0)
2
2
0
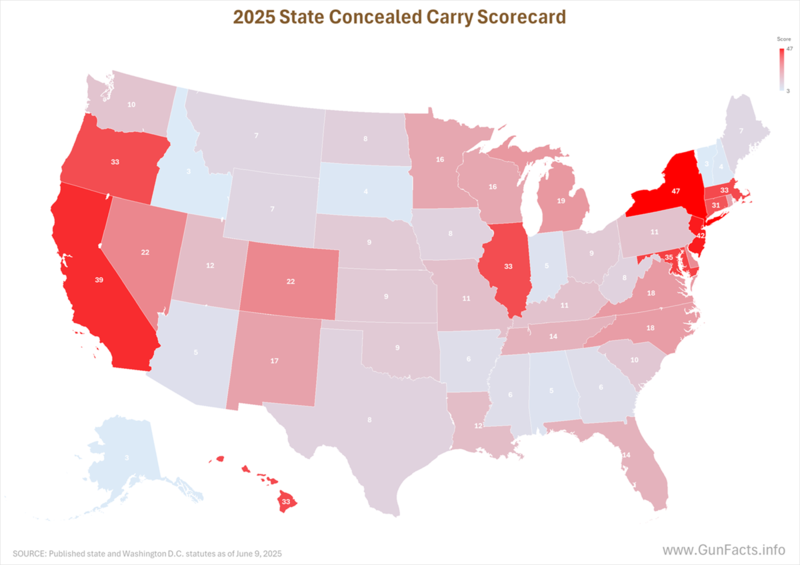
Hmmm... There is a chart showing the scores. The left two columns have the states sorted alphabetically, the right two columns show the states sorted by score. This would be convenient but the chart falls apart because the scores shown are different between the two sets so apparently these are two different sets of data but there is nothing explaining those differences or even telling us which set is which.
Did Alaska change from a 3 to a 4 — or did they change from a 4 to a 3? When were the two sets of data measured? Or did GunFacts just toss random numbers at us? I’m almost leaning towards the random numbers theory! The article talks about the Bruen decision being one reason to change the scorecard and several states have changed their gun laws since Bruen, but Bruen was in 2022. If the two sets of scores are before and after Bruen, that still doesn’t make any sense. Kentucky has a score of 11 on the left and a score of 12 on the right, but Kentucky’s gun laws have not changed significantly since the state adopted permitless carry in 2019.
While the article describes the scoring methodology we don't see any data except the totals. One commenter suggested showing the breakout of how each state scored in each category. "Admin" replied that this would be "A bit of work, but might be worth adding an update." This too makes very little sense. If the states were scored in each category and those scored totaled to give the overall score, then that data has to exist at GunFacts. If that data exists, I would almost bet that it is in a spreadsheet with the rows and columns being the states and the categories. (That's certainly how I would have assembled the totals after a career of presenting data to decision makers.) Any spreadsheet program would spit out the chart we want in seconds.
(2)
(0)
MSG Thomas Currie
GunFacts responded to my comment on their site:
The short answer is that we accidentally omitted a step in our project clean-up.
The two columns on the right had been [a] copied and pasted from the columns on the left and [b] then sorted on the score.
But the numbers on the left are actively calculated. We made a minor tweak in our model after the initial copy/paste and forgot to update the two right columns.
Thanks for catching this. It has been updated.
(1)
(0)
Read This Next
